Table of Contents
- What Are Trading Journal Metrics?
- Why Trading Metrics Matter
- The 15 Most Important Trading Journal Metrics
- Bonus Metrics Worth Tracking
- Trading Metrics Example
- How to Analyze Trading Journal Metrics
- Why PnL Alone Is Not Enough
- How to Use Metrics During a Weekly Review
- How to Use Metrics During a Monthly Review
- Common Mistakes When Interpreting Trading Metrics
- Trading Journal Metrics for Different Markets
- How Trade Journal Desk Helps Analyze Trading Metrics
- Frequently Asked Questions
- Final Verdict
A trader can have a journal containing hundreds of trades and still know very little about their actual performance. That sounds like a contradiction, but it isn't — recording trades is only the first step. The real value comes from analyzing the data sitting inside it, and most traders never get past the recording stage to the analysis that actually changes anything.
A properly analyzed journal can answer questions a trade count alone never will: How often do I actually win? How much do I make when I win, versus how much do I lose when I lose? Which strategy genuinely performs best? Which symbols perform best? Am I risking too much? How large is my drawdown? Do I perform differently on long trades versus short ones? Are my losses caused by a flawed strategy, or by poor execution of a sound one?
This guide walks through the fifteen numbers that answer those questions, how to calculate each one, and — just as important — how to avoid misreading them. If you're still building the habit of logging trades consistently before diving into analysis, why every trader needs a trading journal and how to keep a trading journal cover that ground first. This article assumes the trades are already being recorded and picks up exactly where those leave off: what to actually do with the numbers once they exist. Every Trade Tells a Story — metrics are how you actually read it instead of guessing.
What Are Trading Journal Metrics?
Trading journal metrics are numerical measurements calculated from your historical trades to evaluate performance, risk, consistency, and execution. It helps to separate three distinct layers:
- Trade data — the raw facts. Entry and exit prices are data.
- Metrics — data turned into a number. Win rate is a metric.
- Insights — metrics turned into a conclusion. "Strategy A performs better than Strategy B" is an insight.
Most trading journals stop at the first layer. This article is about the second and third — the part that actually changes how you trade. For the fundamentals of what a trading journal is and what it should capture in the first place, see the full trading journal guide.
Why Trading Metrics Matter
PnL alone does not tell the complete story. It's entirely possible to have a high win rate paired with a poor risk-to-reward ratio, a low win rate paired with strongly positive expectancy, large profits built on excessive risk, or small profits built on excellent consistency. Any single number, viewed alone, can make a trader look better or worse than they actually are. That's why metrics need to be evaluated together, not one at a time — a strategy's win rate means something different depending on its average R:R, and a big profit means something different depending on the drawdown it took to get there.
This is precisely why professional traders and prop firms rarely judge performance on a single figure. A funded-account evaluation, for instance, typically weighs profitability against maximum drawdown and daily loss limits simultaneously — a trader who hits a profit target by taking oversized risk on a handful of trades is treated very differently from one who reaches the same target with steady, controlled sizing throughout. The same logic applies to your own review process: the number that matters is rarely one metric in isolation, but the relationship between two or three of them.
The 15 Most Important Trading Journal Metrics
1. Net PnL
Net PnL = Gross PnL − Trading Costs (fees, commissions, funding where applicable, and other costs)
Gross PnL tells you how the trade itself performed on paper. Net PnL tells you what you actually kept. Example: a trade with $50 gross profit and $8 in combined fees and funding has a net PnL of $42 — the number that actually matters for tracking real performance over time. High-frequency strategies especially need this distinction: a scalping approach that looks strongly profitable on gross numbers can turn out flat or negative once every fee across a hundred small trades is subtracted.
2. Win Rate
Win Rate = Winning Trades ÷ Total Trades × 100
Example: 60 winning trades out of 100 total trades = 60% win rate. A high win rate does not automatically mean a profitable strategy — a trader can win 80% of the time and still lose money overall if the average loss is large enough relative to the average win.
3. Average Win
Average Win = Total Winning PnL ÷ Number of Winning Trades
This number means little on its own. It only becomes useful compared directly against average loss — the relationship between the two is what determines whether a given win rate is actually profitable.
4. Average Loss
Average Loss = Total Losing PnL ÷ Number of Losing Trades
Use the absolute magnitude when comparing — a $150 average loss against a $100 average win tells a very different story than a $60 average loss against that same $100 average win, even at an identical win rate.
5. Average R:R
Risk-to-reward compares what you risked against what you stood to gain. Example: risking $100 for a potential $200 reward is a 1:2 R:R. A favorable R:R is a good sign, but it shouldn't be read in isolation — a strong average R:R paired with a very low win rate can still net out to a losing strategy. Tracking planned R:R against realized R:R separately is also worth doing: a gap between the two often points to trades exited early out of nervousness, well before the original target was hit.
6. Profit Factor
Profit Factor = Gross Profit ÷ Gross Loss (gross loss used as a positive magnitude)
Example: $5,000 gross profit against $3,000 gross loss gives a profit factor of 1.67. There's no universal "ideal" value to chase — a profit factor is only meaningful alongside the sample size it's built on, since a strong number from twelve trades proves far less than the same number from two hundred. It's also worth tracking separately per strategy: a blended profit factor across several different setups can hide one strategy that's dragging the others down.
7. Expectancy
Expectancy = (Win Rate × Average Win) − (Loss Rate × Average Loss)
Expectancy estimates the average profit or loss you can expect per trade, based on your history. Example: a 55% win rate, $120 average win, and $90 average loss gives (0.55 × 120) − (0.45 × 90) = $66 − $40.50 = $25.50 expected per trade. This depends entirely on consistent definitions of "win" and "loss" and a genuinely representative sample — a handful of trades can produce a misleadingly rosy or grim expectancy figure. A positive expectancy is what actually justifies scaling up a strategy over time; a negative one is a sign to fix the process before increasing size, not after.
8. Maximum Drawdown
Maximum drawdown is the largest peak-to-trough decline in account or equity value over a given period. If an account grows to a $10,000 peak and later falls to $8,200 before recovering, that's a $1,800 (18%) drawdown. It's worth monitoring closely because it's the number that most directly reflects how much pain a strategy can actually put you through — not just whether it's profitable on average. Two strategies with identical net PnL over a year can have very different drawdown profiles, and the one with the deeper, longer drawdown is the harder one to actually stay disciplined through in real time, whatever the year-end total says.
9. Winning Streak
The maximum number of consecutive winning trades in your history. A long winning streak can be a genuine sign of a strategy working well — or a sign that a strategy hasn't yet met the market conditions that will end it. Either way, it's useful context for understanding how "smooth" or "lumpy" a strategy's results tend to be, and it's worth watching for whether position sizing crept up during the streak, since that's a common, easy-to-miss habit.
10. Losing Streak
The maximum number of consecutive losing trades. This matters for risk planning (can your account survive your worst historical streak happening again?), emotional discipline (a five-loss streak feels very different in the moment than it looks in hindsight), and understanding how much natural variability your strategy has. None of this is a reason to increase risk in an attempt to recover losses faster — that instinct is exactly what turns a normal losing streak into a much deeper one.
Knowing your longest historical losing streak in advance changes how the next one feels while it's happening. A trader who knows their strategy has produced a run of six consecutive losses before, and recovered, can sit through a similar stretch with far more composure than one seeing it for the first time and assuming something has gone fundamentally wrong.
11. Number of Trades
Your sample size — the basis for trusting every other metric on this list. A hundred trades generally provide more reliable information than five, but there's no specific number that guarantees a conclusion is safe to act on. Treat every metric as provisional until the sample behind it feels genuinely representative of how you actually trade. This is also where having a consistent, structured record from day one pays off — a ready-to-use trading journal template makes it far easier to build a large, comparable sample than a format that changes every few weeks.
12. Risk per Trade
The amount at risk, expressed both in currency and as a percentage of account capital, alongside position size and stop-loss placement. Consistent risk measurement is what makes every other performance number comparable across trades — a win rate calculated across wildly different risk levels per trade is measuring something less meaningful than it appears to be. Tracking this trade by trade also surfaces a common, quiet habit: risk that creeps up after a win and shrinks defensively after a loss, the opposite of what disciplined position sizing is supposed to look like.
13. Strategy Performance
Grouping trades by strategy — breakout, pullback, reversal, trend following, scalping, or whatever setups you actually use — and comparing number of trades, win rate, net PnL, average win, average loss, profit factor, and drawdown per strategy. This is one of the highest-value breakdowns in the whole journal: it's what actually tells you which strategies deserve more attention and which deserve a harder look. A trader running three strategies at once often assumes they contribute roughly equally to results; broken out individually, it's common to find one strategy carrying most of the profit while another has been quietly break-even or negative the whole time.
14. Symbol / Market Performance
The same breakdown, grouped by instrument instead of strategy — BTC, ETH, gold, specific forex pairs, individual stocks, or whichever symbols make up your trading. This isn't about which asset is a better investment; it's about discovering where your own historical execution has actually been strongest and weakest. A trader who trades both crypto and forex, for instance, might find their edge is concentrated almost entirely in one market — information that's invisible in a single blended PnL number.
15. Rule Violation Rate
Rule Violation Rate = Trades With Rule Violations ÷ Total Trades × 100
Examples of a violation: entering without confirmation, moving a stop loss, an oversized position, a revenge trade, trading outside the plan, or ignoring a setup's own entry rules. This is one of the most differentiating metrics on this list because it can reveal a real execution problem even when PnL still looks perfectly acceptable — a trader can be quietly profitable while breaking their own rules on a third of their trades, right up until the month that streak of luck runs out.
Most trading journals never calculate this number at all, because it requires a field almost nobody logs consistently: whether the trade actually followed the plan, recorded honestly, trade after trade. It's worth adding specifically because it's the metric most likely to catch a problem before it shows up in the PnL — by the time rule violations are visible in the profit numbers, the habit is usually well established.
Bonus Metrics Worth Tracking
The fifteen above cover the core of most performance reviews. Once those become routine, these secondary metrics tend to be where the more specific, personal insights show up — the kind that don't apply to every trader equally, but can matter a great deal for yours specifically:
- Long vs. short performance — reveals any directional bias in your results.
- Session performance — whether a particular time window tends to suit you better.
- Holding time — how trade duration relates to outcome.
- Best and worst trading day — outliers worth understanding individually.
- Best trading hour — a finer-grained version of session performance.
- Average position size — a sanity check against your stated risk rules.
- Fee percentage — how much of gross profit costs are actually consuming.
- Slippage, where measurable — the gap between planned and actual fill.
- Consecutive rule-following trades — a discipline streak worth being proud of, separate from a winning streak.
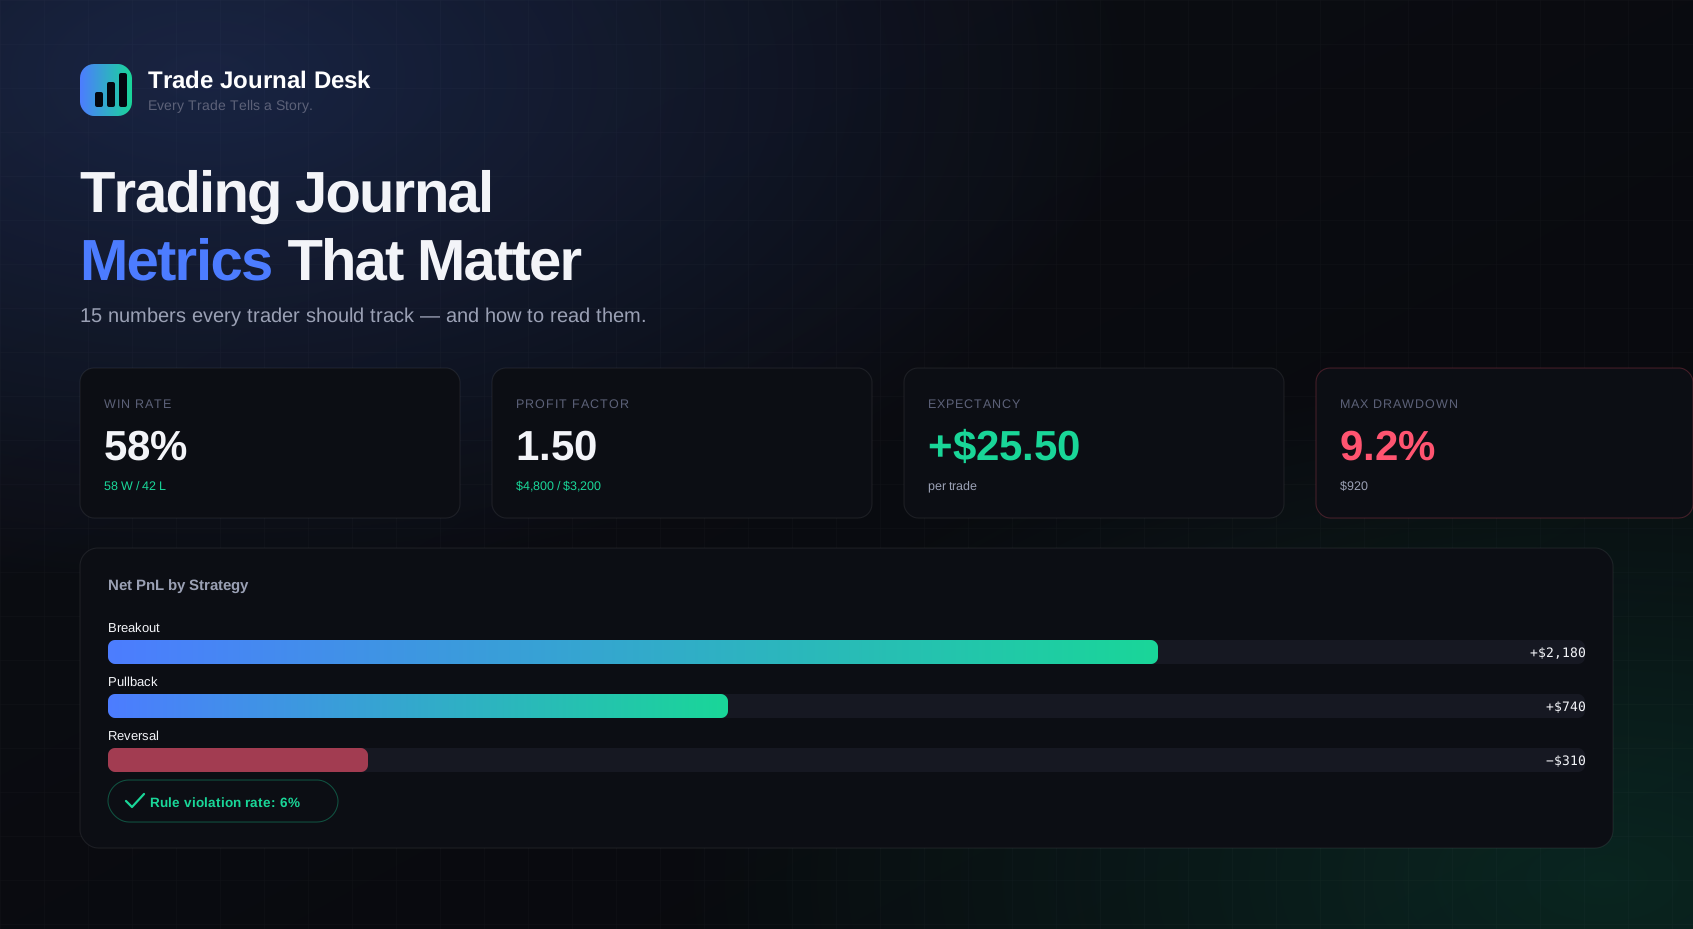
Trading Metrics Example
The figures below are a fictional monthly report for illustration only — not real trading results or a performance claim.
| Metric | Value |
|---|---|
| Total Trades | 100 |
| Winning Trades | 58 |
| Losing Trades | 42 |
| Gross Profit | $4,800 |
| Gross Loss | $3,200 |
| Fees | $180 |
| Net PnL | $1,420 |
| Win Rate | 58% |
| Average Win | $82.76 |
| Average Loss | $76.19 |
| Profit Factor | 1.5 |
| Average R:R | 1:1.4 |
| Maximum Drawdown | $920 (9.2%) |
Read together, this is a moderately positive month: a win rate above 50%, a profit factor comfortably over 1, and a drawdown that stayed well inside what most traders would consider manageable. None of those numbers alone would fully justify that read — it's the combination that does.
Notice something else in this table: the average win ($82.76) and average loss ($76.19) are close to each other, while the win rate is a respectable 58%. That combination — a win rate meaningfully above 50% with wins and losses of similar size — is a genuinely different profile from a low win rate carried entirely by a few oversized wins, even though both can arrive at a similar profit factor. Reading the full set of numbers together, rather than any one of them, is what reveals the difference.
How to Analyze Trading Journal Metrics
Faced with a full dashboard of numbers, it's tempting to jump straight to whichever metric feels most urgent — usually net PnL, good or bad. A more useful approach works from the outside in: start broad, then narrow down to the specific area that actually explains what the headline numbers are showing.
Look at overall performance
Net PnL, win rate, profit factor, and expectancy — the headline numbers.
Look at risk
Risk per trade, average R:R, and maximum drawdown.
Look at strategy
Break performance down by strategy — which ones are actually carrying the results.
Look at market/symbol
The same breakdown, by instrument this time.
Look at psychology and rule violations
Whether emotional patterns or broken rules are quietly shaping the numbers above.
Find patterns
Look for something that repeats across multiple trades, not a single outlier.
Choose one or two areas to improve
Not five. A review that produces one concrete change beats one that produces a long list nobody follows through on.
Why PnL Alone Is Not Enough
Consider two fictional traders over the same month:
| Trader A | Trader B | |
|---|---|---|
| Win Rate | 80% | 45% |
| Average Win | Small | Larger |
| Average Loss | Large | Smaller |
Trader A wins far more often — but if those infrequent losses are large enough relative to the small, frequent wins, Trader A can easily end up less profitable, or riskier, than Trader B despite the much lower win rate. Trader A is not automatically the better trader just because the win-rate number looks more impressive. This is exactly why win rate, average win, average loss, and R:R need to be read together rather than treated as separate scores.
How to Use Metrics During a Weekly Review
A short, consistent checklist works better than an exhaustive one you eventually skip:
- Total trades
- Net PnL
- Win rate
- Average win and average loss
- R:R
- Profit factor
- Biggest drawdown
- Best strategy
- Worst strategy
- Rule violations
- Emotional mistakes
Then ask one specific question: "What is the biggest repeatable issue I should improve next week?" Resist the urge to list several — a weekly review that identifies one fixable issue and actually tracks whether it improved the following week is worth more than one that produces a long list nobody follows up on. For a deeper walkthrough of building this habit day to day, see how to keep a trading journal.
How to Use Metrics During a Monthly Review
Monthly review goes a layer deeper — comparing the current month against previous ones rather than judging it in isolation. Analyze net PnL, drawdown, win rate, profit factor, expectancy, strategy performance, symbol performance, long/short performance, risk consistency, and rule violations, side by side with prior months. The goal is spotting trends, not re-litigating individual trades — a single rough week can look alarming on its own but be unremarkable against three months of context.
A practical way to keep this from becoming overwhelming: pick two or three metrics as your primary trend indicators — net PnL and drawdown are a reasonable default — and treat the rest as supporting context you check only when the primary indicators show something worth investigating further. The full step-by-step process for building a journal that supports this kind of review is covered in how to create a trading journal.
Common Mistakes When Interpreting Trading Metrics
- Focusing only on win rate — the single most common misread on this list; it means little without average win and average loss alongside it, and a genuinely strong win rate can still mask a losing strategy.
- Ignoring fees — gross PnL can look healthy while fees quietly erode most of the real return, especially for strategies with a high trade count.
- Ignoring drawdown — a profitable strategy can still be a genuinely painful one to hold through, and drawdown is often what actually breaks a trader's discipline, not a losing month on its own.
- Using too small a sample — a handful of trades can produce a flattering or damning number that simply doesn't hold up once more data comes in.
- Changing strategies constantly — makes it impossible to build a meaningful sample for any one of them, so every strategy stays permanently under-tested.
- Comparing different risk levels without context — a bigger win rate at much higher risk isn't a fair comparison to a smaller one at lower risk; normalize for risk before comparing.
- Ignoring rule violations — profitable months built on broken rules tend to stop being profitable eventually, once the variance that was covering for the broken process runs out.
- Looking only at profitable months — skips exactly the data with the most to teach; losing months usually contain more useful information than winning ones.
- Ignoring psychology — misses the behavioral root behind a large share of recurring mistakes, since most rule violations trace back to an emotional state rather than a strategy flaw.
- Over-optimizing historical data — fitting a strategy so tightly to past trades that it stops reflecting how markets actually behave going forward, sometimes called curve-fitting.
Trading Journal Metrics for Different Markets
The core metrics apply everywhere, though a few extra fields are worth tracking per market:
- Crypto — fees, funding, long/short, and leverage where relevant.
- Forex — pair, session, position size, and spread/costs.
- Indian stocks — symbol, quantity, brokerage and statutory charges, entry/exit.
- Commodities — contract, quantity, entry/exit, and costs.
- Futures & options — contract, strike, expiry, quantity, premium, and costs.
None of this changes the underlying formulas — win rate, profit factor, and expectancy mean the same thing regardless of market. It just changes which extra fields are worth capturing to keep the core numbers accurate. A crypto trader who ignores funding fees, or a futures trader who ignores contract size when comparing position risk across instruments, ends up with metrics that look precise but are quietly measuring the wrong thing.
How Trade Journal Desk Helps Analyze Trading Metrics
Every metric in this guide can be calculated by hand — the formulas are straightforward. What's genuinely time-consuming is recalculating them every week across a growing trade history, broken down by strategy and symbol, without making an arithmetic mistake along the way. A spreadsheet can do this too, with enough formulas built and maintained manually; see Excel vs trading journal software for exactly where that manual approach starts to strain. Trade Journal Desk is built around removing that manual step entirely. It includes:
- Automatic PnL calculation, gross and net
- Automatic risk and R:R tracking
- Strategy-level performance tracking
- Built-in performance analytics
- A trading calendar view
- Full trade history with search and filters
- Screenshots attached directly to trades
- Structured psychology tracking
- Structured mistake tracking
- Built-in reports
- A responsive, dark-themed interface
- Support for crypto, forex, commodities, and Indian stocks
- Multi-currency support
Structured data is what makes the jump from individual trades to genuine insight possible in the first place — the more consistently every trade is logged the same way, the more the metrics above actually mean. Every Trade Tells a Story — Trade Journal Desk is built to help you read it without doing the arithmetic yourself.
Frequently Asked Questions
What are trading journal metrics?
Numerical measurements calculated from your historical trades — like win rate, profit factor, and expectancy — used to evaluate performance, risk, consistency, and execution rather than relying on memory or a single PnL number.
What is the most important trading metric?
There isn't one — win rate, average R:R, profit factor, and expectancy all need to be read together. Any single metric in isolation can make performance look better or worse than it actually is.
Is win rate enough to measure trading performance?
No. A high win rate with a poor risk-to-reward ratio can still be unprofitable, while a lower win rate with strong average wins relative to losses can be solidly profitable.
What is profit factor?
Gross profit divided by gross loss (using gross loss as a positive number). A profit factor above 1 means you're net profitable over the sample measured — there's no single "ideal" value that applies universally.
What is trading expectancy?
The average amount you can expect to profit or lose per trade, based on your history: (win rate × average win) − (loss rate × average loss). It depends on a consistent, representative sample to be meaningful.
What is maximum drawdown?
The largest peak-to-trough decline in account or equity value over a given period — the number that most directly reflects how much pain a strategy can put you through, independent of its average profitability.
What is a good risk-to-reward ratio?
There's no universal figure — R:R only means something alongside your win rate. A 1:1 R:R can be profitable at a high enough win rate, and a 1:3 R:R can still lose money at a low enough one.
How do I calculate trading win rate?
Winning trades divided by total trades, multiplied by 100. 60 wins out of 100 trades is a 60% win rate.
How do I calculate average win?
Total profit from winning trades divided by the number of winning trades.
How do I calculate average loss?
Total loss from losing trades divided by the number of losing trades — use the absolute (positive) magnitude when comparing it against average win.
How do I calculate profit factor?
Divide gross profit by gross loss, treating gross loss as a positive number. $5,000 gross profit against $3,000 gross loss gives a profit factor of 1.67.
How do I calculate expectancy?
(Win rate × average win) minus (loss rate × average loss). A 55% win rate with a $120 average win and $90 average loss gives roughly $25.50 expected per trade.
How many trades should I analyze?
There's no fixed minimum — more trades generally provide more reliable information, but what matters most is whether the sample reflects a consistent strategy, risk level, and execution style.
Should I track trading fees?
Yes. Fees, commissions, and funding costs are the difference between gross and net PnL, and ignoring them can make performance look better than it actually is.
Should I track rule violations?
Yes — it's one of the few metrics that can reveal a real execution problem even while overall PnL still looks acceptable.
Should I track psychology?
Yes. Emotional state, tagged before, during, and after a trade, often explains patterns that the raw numbers alone can't.
What metrics should beginners track?
Win rate, average win, average loss, R:R, and net PnL cover the essentials. Profit factor, expectancy, and drawdown become more useful as trade history grows — see choosing a trading journal as a beginner for the full starting-point checklist.
Can a trading journal calculate PnL automatically?
Dedicated trading journal software typically calculates gross and net PnL automatically from entry, exit, quantity, and costs — spreadsheets can too, with formulas built and maintained manually.
Can I track crypto and stock trades together?
Yes, though it's worth keeping currency and market context separate when comparing performance, since blending very different instruments into one blended number can obscure more than it reveals.
What is Trade Journal Desk?
A trading journal and analytics platform that automates PnL, risk, and R:R calculations and provides built-in performance analytics across strategies, symbols, and markets — including crypto, forex, commodities, and Indian stocks.
Final Verdict
A trading journal becomes far more powerful the moment you start analyzing the data inside it instead of just accumulating it. Don't obsess over any single number — look at performance, risk, strategy, execution, psychology, and consistency together, since each one only means so much on its own.
The fifteen metrics in this guide aren't a one-time checklist to calculate once and forget. They're a recurring lens — the same numbers, reviewed on the same weekly and monthly rhythm, month after month, are what actually let a trader tell the difference between normal variance and a real, addressable problem. That distinction is the whole point of keeping a journal in the first place.
Trade Journal Desk is a trading journal and analytics tool. It does not provide investment advice, trading signals, or guarantees of profit. Trading involves risk.
Every Trade Tells a Story.
Start Journaling Free — 10 free trades, no payment required to start.
Keep Exploring
Ready to understand your trading like never before?
Start using Trade Journal Desk and discover why Every Trade Tells a Story.