Table of Contents
- What Is an Excel Trading Journal?
- What Is Trading Journal Software?
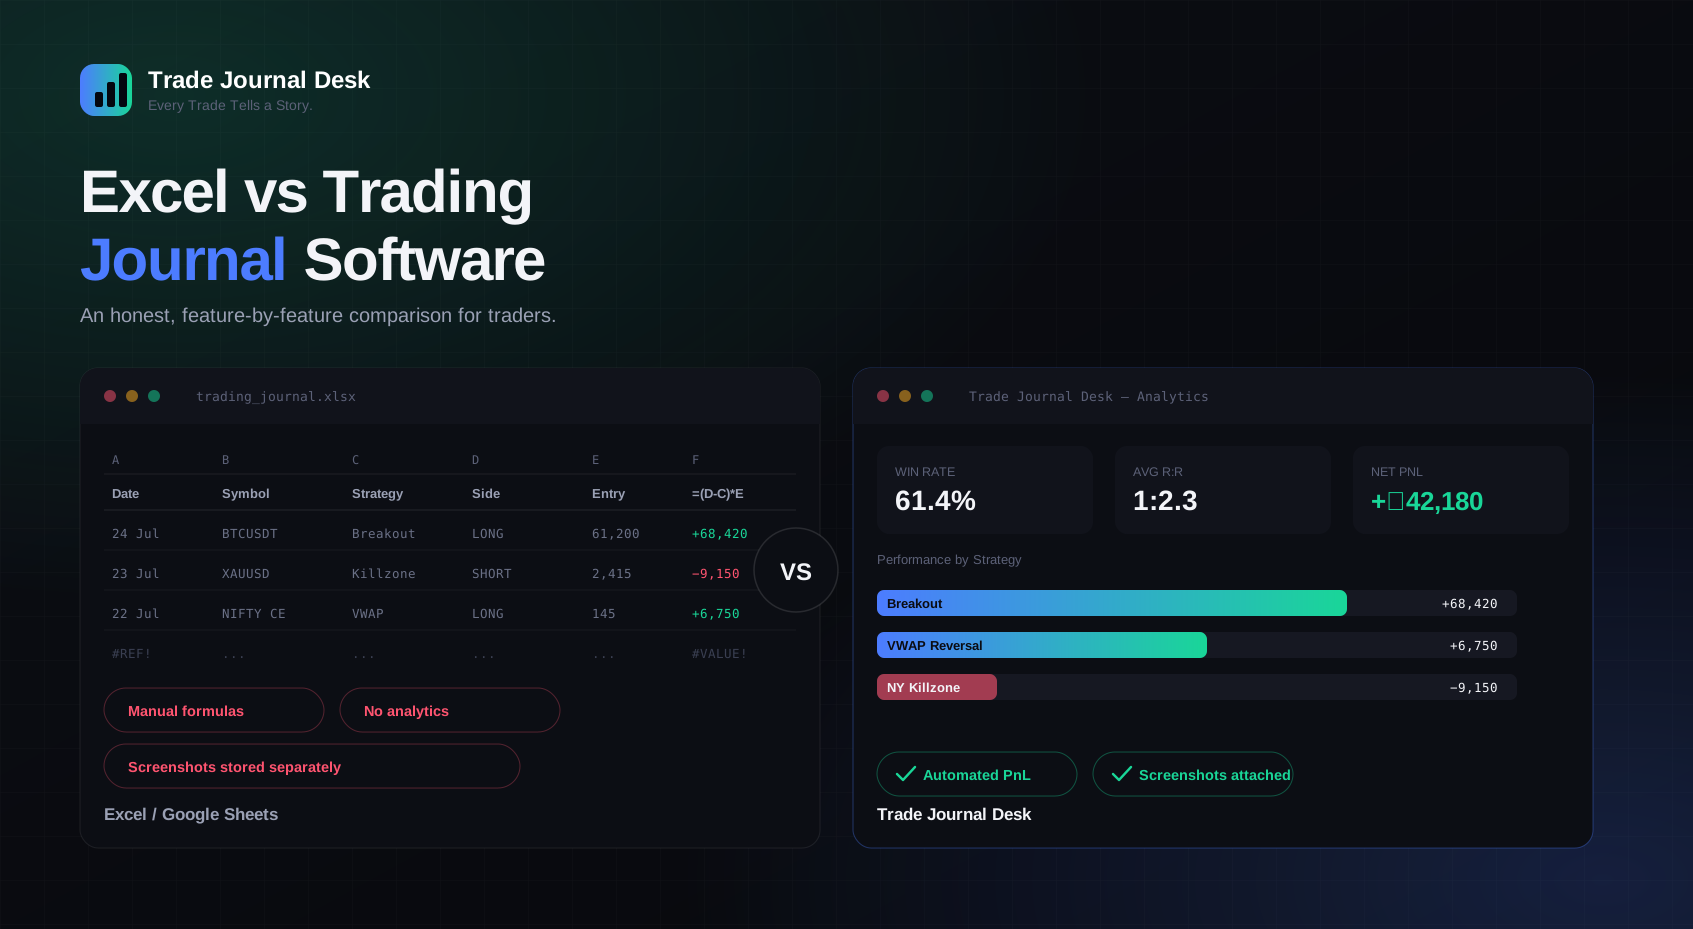
- Excel vs Trading Journal Software: Quick Comparison
- Is Excel Good Enough for a Trading Journal?
- Advantages of Using Excel for Trading
- How to Build a Basic Trading Journal in Excel
- Disadvantages of Using Excel for Trading
- Advantages of Dedicated Trading Journal Software
- Excel vs Software: A Real-World Example
- What Should a Modern Trading Journal Track?
- PnL and Risk Calculations
- Why Trading Psychology Is Difficult to Track in Excel
- Screenshots and Trade Review
- Strategy Analytics
- When Should You Switch From Excel to Trading Journal Software?
- Who Should Use Excel?
- Who Should Use Trading Journal Software?
- How Trade Journal Desk Compares
- Trade Journal Desk Pricing
- Frequently Asked Questions
- Final Verdict
Most traders don't start with software. They start with a spreadsheet.
It usually goes something like this: you open Excel or Google Sheets, create a few columns — entry, exit, quantity, profit and loss — and start logging trades. For the first few weeks, it works well. The sheet is simple, it's yours, and every number in it makes sense.
Then the trade count climbs. Fifty trades becomes two hundred, and two hundred becomes five hundred. Now you're not just recording trades — you're trying to answer harder questions from the same sheet:
- Which strategy actually performs best?
- Which symbol makes you the most money — and which one quietly drains it?
- What's your real win rate, not the one you remember?
- Which session or time of day performs best for you?
- How much are avoidable mistakes actually costing you?
- Are your emotions changing how you trade — and can you prove it?
- What's your average risk-to-reward, across all trades and by strategy?
- What's your maximum drawdown, and when did it happen?
Excel can technically answer all of these. The question isn't whether it's possible — it's whether it's still the best use of your time once the sheet has grown past a few hundred rows and a dozen formulas you wrote six months ago and no longer fully remember.
That's the real difference between a spreadsheet and dedicated trading journal software: not what each one can theoretically do, but what each one costs you in time, maintenance, and mental energy to get the same answer. This guide walks through both sides honestly — where Excel genuinely holds up, where it starts to strain, and what a purpose-built tool changes about the process.
What Is an Excel Trading Journal?
An Excel trading journal is a spreadsheet — built in Microsoft Excel, Google Sheets, or a similar tool — where a trader manually logs each trade as a row of data. There's no fixed template; every trader's sheet looks slightly different, but most converge on a similar set of columns:
| Column | Purpose |
|---|---|
| Date | When the trade was opened |
| Symbol | The instrument traded — e.g. BTCUSDT, EURUSD, RELIANCE, ES futures |
| Strategy | The setup used — breakout, pullback, EMA crossover, etc. |
| Side | Long or short |
| Entry | Entry price |
| Exit | Exit price |
| Quantity | Position size |
| Stop Loss | Planned exit if the trade goes wrong |
| Take Profit | Planned target |
| PnL | Profit or loss on the trade, usually a formula |
| R:R | Risk-to-reward ratio, also usually a formula |
| Notes | Free-text context — why the trade was taken, what happened |
Excel remains a genuinely popular starting point for a reason. It's:
- Familiar — most traders already know how to use a spreadsheet, so there's no learning curve.
- Flexible — you can add, remove, or rename any column at any time.
- Cheap — many traders already have Excel, and Google Sheets is free.
- Customizable — you can build formulas and small dashboards exactly the way you think.
- Good for basic calculations — SUM, AVERAGE, and simple PnL formulas cover a lot of ground.
For a trader logging their first few dozen trades, a trading journal template in Excel or Google Sheets is often the fastest way to start — no signup, no setup, just a blank sheet and a habit to build.
What Is Trading Journal Software?
Trading journal software is a purpose-built application — web-based or desktop — designed specifically around the workflow of logging, calculating, and reviewing trades. Instead of a blank grid you shape yourself, the structure already exists: fields are predefined, calculations run automatically, and the layout is built around how traders actually review their performance.
Most dedicated trading journal tools are built around a similar core feature set:
- Structured trade entry — a form with the right fields already in place, instead of a blank row.
- Automated calculations — PnL, R:R, and win rate computed the moment a trade is saved.
- Analytics and charts — performance broken down by strategy, symbol, session, and time.
- Strategy and risk tracking — seeing which setups and risk levels actually work.
- Psychology tracking — logging emotional state and mistakes alongside the trade itself.
- Screenshots — chart context attached directly to the trade it belongs to.
- Calendar view — a day-by-day picture of performance over time.
- Reports — pre-built summaries instead of manually built pivot tables.
- Search and filtering — finding every trade that matches a specific condition in seconds.
The core idea isn't that this software can do something Excel fundamentally can't. It's that the workflow is designed around trading specifically, instead of being a general-purpose grid you have to adapt. If you want a fuller picture of what a trading journal is and why traders keep one at all, that's covered in detail in a separate guide.
Excel vs Trading Journal Software: Quick Comparison
Here's a factual, feature-by-feature comparison across Excel, Google Sheets, and dedicated trading journal software.
| Feature | Excel | Google Sheets | Trading Journal Software |
|---|---|---|---|
| Trade entry | Manual row entry | Manual row entry | Structured form |
| PnL calculation | Manual formula | Manual formula | Automatic |
| R:R calculation | Manual formula | Manual formula | Automatic |
| Risk tracking | Manual, if built | Manual, if built | Built in |
| Strategy tracking | Manual tagging | Manual tagging | Structured field + analytics |
| Performance analytics | Manual pivot tables | Manual pivot tables | Built-in dashboards |
| Charts | Manual chart building | Manual chart building | Pre-built, auto-updating |
| Calendar view | Not built in | Not built in | Usually built in |
| Screenshots | External folder, linked manually | External folder, linked manually | Attached directly to the trade |
| Psychology tracking | Free-text column only | Free-text column only | Structured fields and tags |
| Mistake tracking | Free-text column only | Free-text column only | Structured field + reporting |
| Trade review | Manual scrolling/filtering | Manual scrolling/filtering | Dedicated review views |
| Search | Ctrl+F / filters | Ctrl+F / filters | Purpose-built search |
| Filtering | Manual filter setup | Manual filter setup | Built-in filters |
| Reports | Manual construction | Manual construction | Generated automatically |
| Mobile experience | Limited, fiddly | Usable but cramped | Usually built for mobile use |
| Cloud access | Only with OneDrive setup | Native | Native |
| Automation | Low, unless scripted | Low, unless scripted | High |
| Customization | Very high | Very high | Limited to what the tool exposes |
| Ease of use (early on) | High | High | Moderate — some setup to learn |
| Maintenance over time | Grows harder | Grows harder | Stays roughly the same |
Excel is best for traders with a small number of trades, simple strategies, and a preference for building their own system. Trading journal software becomes more valuable once you want automated calculations, structured analytics, and faster review — usually somewhere between a few dozen and a few hundred trades in.
Is Excel Good Enough for a Trading Journal?
Yes — for a specific kind of trader, in a specific stage of their journey, Excel is genuinely good enough. It's worth being honest about this instead of dismissing spreadsheets outright.
Excel tends to work well when:
- You're new to trading and still figuring out what you even want to track.
- You're logging a small number of trades — think dozens, not hundreds, per month.
- You trade one or two simple strategies, not a dozen variations.
- You're comfortable writing and maintaining spreadsheet formulas.
- You want complete control over the exact layout and fields, with no constraints.
Where it starts to strain is less about a hard trade-count threshold and more about complexity compounding: more strategies, more symbols, more months of history, more questions you want answered at once. A ten-column sheet with fifty rows is trivial to reason about. A forty-column sheet with two thousand rows, a dozen interlinked formulas, and three years of history is a different problem entirely — not impossible, just slower and more fragile.
Advantages of Using Excel for Trading
1. Flexible
You define the structure. Want a column for "setup confidence" or "market regime"? Add it in seconds. No tool constrains what you can track.
2. Familiar
Most people already know how spreadsheets work. There's no interface to learn, no account to create — just a blank sheet and your own habits.
3. Customizable
Formulas, conditional formatting, and simple dashboards can be built exactly the way you think about your own trading, rather than the way a product designer thought about trading in general.
4. Low cost
If you already have Excel through work or school, or you use Google Sheets, there's no additional cost to start a journal today.
5. Good for learning
Building your own PnL and R:R formulas from scratch is a genuinely useful exercise. It forces you to understand exactly how those numbers are derived, instead of trusting a dashboard you've never looked under the hood of.
How to Build a Basic Trading Journal in Excel
If you'd rather start with a spreadsheet today, here's a practical way to set one up in under twenty minutes.
Create the core columns
Start a new sheet with Date, Symbol, Strategy, Side, Entry, Exit, Quantity, Stop Loss, Take Profit, and Notes across the top row. Freeze that row so it stays visible as you scroll.
Add the PnL formula
For a long trade, PnL = (Exit − Entry) × Quantity. For a short trade, flip it: (Entry − Exit) × Quantity. A simple IF formula checking the Side column can apply the right one automatically.
Add a Risk and R:R column
Risk is the distance from entry to stop loss, multiplied by quantity. R:R divides the reward (distance from entry to take profit) by that risk figure — this tells you, at a glance, whether a setup was worth taking on paper before you even know the outcome.
Build one summary tab
On a second sheet, use AVERAGE, COUNTIF, and SUMIF formulas to calculate win rate, average R:R, and total PnL by strategy. This is the tab you'll actually open during a weekly review.
Log every trade the same day
The structure only pays off if it's filled in consistently. A perfectly designed spreadsheet with gaps in it is less useful than a simple one that's actually kept up to date.
Disadvantages of Using Excel for Trading
None of the following means Excel can't do these things — it can. The issue is time and maintenance, not capability.
- Manual data entry — every trade has to be typed in by hand, row by row.
- Manual formulas — PnL, R:R, and win rate all need to be built and maintained yourself.
- Formula errors — one broken cell reference or a row inserted in the wrong place can silently skew every number downstream.
- Ongoing maintenance — as your tracking needs grow, the sheet needs to be restructured, and old rows may not match new columns.
- Awkward screenshot management — chart screenshots usually live in a separate folder, only loosely linked to the trade they belong to.
- Limited psychology workflow — emotional state and mistakes usually end up in a single free-text notes column, hard to analyze in aggregate.
- Time-consuming analytics — every new question ("what's my win rate by session?") means building a new pivot table or formula.
- Harder trade review — there's no dedicated view for reviewing a single trade in context; you're scrolling a row into view each time.
- Large datasets slow down — sheets with thousands of rows and heavy formulas can genuinely lag, especially in Google Sheets.
- Inconvenient on mobile — logging a trade from your phone in a cramped spreadsheet view is rarely pleasant.
- Dashboards require manual construction — every chart is something you build and then have to remember to update.
Advantages of Dedicated Trading Journal Software
The list of features is long — faster trade entry, automated calculations, built-in analytics, strategy and risk breakdowns, psychology tracking, attached screenshots, a calendar view, search and filters, and pre-built reports. But the headline benefit isn't the feature count itself.
The real advantage of dedicated software isn't "more features." It's less manual work per trade and faster, less error-prone review — so more of your time goes to actually thinking about your trading, not maintaining the sheet that tracks it.
Concretely, that means:
- Faster trade entry — a structured form is quicker to fill than typing across a dozen spreadsheet cells.
- Automated calculations — PnL, R:R, and win rate update the moment a trade is saved, with nothing to break.
- Built-in analytics — performance by strategy, symbol, and time period, without building a single pivot table.
- Risk analysis — seeing how your actual risk-taking compares to your plan.
- Psychology tracking — structured fields for emotion and mistakes, so patterns are visible instead of buried in notes.
- Screenshots attached to trades — chart context sits right next to the trade it explains.
- Calendar view — a day-by-day shape of your performance, at a glance.
- Search and filters — finding every trade matching a condition in seconds, not minutes.
- Structured trade reviews — a dedicated place to look back at a trade, not a row in a giant table.
- Cloud access — your journal follows you across devices without manual file syncing.
Excel vs Software: A Real-World Example
Consider a trader who has logged 500 trades over a year and wants to answer eight specific questions: best strategy, best symbol, win rate, average R:R, monthly PnL, maximum drawdown, long vs. short performance, and how often emotional mistakes show up.
In Excel, this typically means: building a pivot table grouped by strategy, another grouped by symbol, a manual win-rate formula (count of winning trades divided by total trades), an AVERAGEIF for R:R, a monthly SUMIF for PnL, a running-balance column with a MIN formula to find the drawdown, a filter split for long vs. short, and a count of how many notes mention specific keywords like "FOMO" or "revenge." Each of these is achievable — but each is also a separate piece of spreadsheet engineering that has to be built once and then kept working as more rows get added.
In dedicated trading journal software, most of these numbers are already sitting in a dashboard: strategy and symbol performance broken out automatically, win rate and average R:R computed continuously, a monthly PnL view, and a drawdown figure calculated from the trade history. The emotional-mistake pattern is the one place software doesn't just hand you the answer — but if mistakes and emotions were logged as structured tags rather than free text, filtering by tag turns it into a two-click question instead of a manual keyword search.
No performance numbers are implied here — this is about the mechanics of getting to an answer, not a claim about what any specific trader's results would be.
The gap widens further once the trader wants to ask a new question that wasn't planned for at the start — say, comparing performance across market sessions, or isolating trades taken after a losing streak. In Excel, each new question is a new formula or pivot table to design from scratch. In dedicated software, it's usually a matter of applying a different filter to data that's already structured the same way across every trade, which is where the time savings compound the most as your trade history grows.
What Should a Modern Trading Journal Track?
Whether you use Excel or dedicated software, the underlying fields worth tracking are largely the same. Here's a fuller field list than the basic version covered earlier:
| Field | Why it matters |
|---|---|
| Date & Time | Reveals patterns by day, session, or time of day |
| Market | Crypto, forex, stocks, futures, options — separates apples from oranges |
| Symbol | Identifies which instruments actually perform for you |
| Strategy | The single most useful field for finding what works |
| Side (Long/Short) | Shows whether direction bias affects your results |
| Entry & Exit | The raw inputs every other calculation depends on |
| Quantity | Needed to convert price movement into actual PnL |
| Stop Loss & Take Profit | Compares your plan to what actually happened |
| Gross PnL & Fees | Separates trading performance from the cost of trading |
| Net PnL | What you actually made or lost, after costs |
| Risk & Reward | The basis for your R:R and position sizing discipline |
| R:R | Shows whether your wins are structurally bigger than your losses |
| Screenshot | Chart context you can't fully reconstruct from numbers alone |
| Emotion | Surfaces whether state of mind correlates with outcomes |
| Mistake | The fastest way to find your most expensive recurring error |
| Notes | Freeform context that structured fields can't capture |
| Tags | Makes filtering and pattern-finding possible later |
For a deeper walkthrough of building this out field by field — including a ready-to-use column structure — see the full trading journal template guide.
PnL and Risk Calculations
Whether calculated in a spreadsheet formula or automatically by software, the underlying math is the same. A trading journal — in any form — can calculate:
- Gross PnL
- Net PnL (after fees)
- Risk amount
- Reward amount
- R:R ratio
- ROI
- Win/loss status
Take a simple long trade as an example:
| Field | Value |
|---|---|
| Entry | 61,000 |
| Exit | 62,000 |
| Quantity | 0.01 BTC |
The formula for a long position is:
PnL = (Exit − Entry) × Quantity
PnL = (62,000 − 61,000) × 0.01 = 10 USDT
For a short position, the formula flips, since profit comes from the price falling rather than rising:
PnL = (Entry − Exit) × Quantity
So a short entered at 61,000 and closed at 60,000 with the same 0.01 BTC quantity would be: (61,000 − 60,000) × 0.01 = 10 USDT.
These figures are gross PnL only. Actual net PnL will typically differ once you account for trading fees, funding rates (on perpetual futures), commissions, slippage, and taxes. Always treat gross PnL as a starting point, not the final number.
Why Trading Psychology Is Difficult to Track in Excel
Most trading mistakes have a psychological root: fear, greed, FOMO, revenge trading, overconfidence, impatience, or simply breaking a rule you'd already set for yourself. These patterns are usually real and usually repeat — but they're genuinely hard to see in a spreadsheet, because they tend to live in a single free-text "notes" column that isn't built for aggregation.
You can, of course, search that column for keywords, or build a tally of how often certain words appear. But it's manual, it's easy to under-count (not every FOMO trade gets the word "FOMO" written next to it), and it doesn't scale well past a hundred or so trades.
Structured fields — a dropdown for emotion, a tag for mistake type — make this kind of review much more direct: filter every trade tagged "FOMO" and look at the aggregate PnL, or count how often "moved my stop" appears as a tag versus a search term buried in a paragraph.
Structured tracking doesn't fix psychology by itself — no tool does. What it does is make patterns visible faster, so you're reacting to evidence instead of a vague feeling that "I keep doing this."
Screenshots and Trade Review
A chart screenshot captures things numbers alone can't: the setup that triggered the entry, market structure at the time, the indicators you were watching, and exactly where and why you exited.
In a spreadsheet, screenshots usually live in a separate folder on your computer or cloud drive, loosely connected to a trade through a filename convention or a manually pasted link — something that works until the folder grows large enough that finding the right image takes real effort.
Dedicated software generally attaches the screenshot directly to the trade record itself, so reviewing a trade means opening one record and seeing the number, the chart, and your notes together — instead of cross-referencing a spreadsheet row against a separate file browser.
This matters more than it might sound like on paper. A weekly review of thirty trades in a spreadsheet-plus-folder setup means thirty context switches between two different windows. The same review with attached screenshots is a single, linear scroll — which is a small difference per trade, but a meaningful one across a habit you're supposed to keep up every week.
Strategy Analytics
Say you trade four setups: breakout, EMA crossover, pullback, and VWAP reversion. Over time, the question that matters most isn't "am I profitable overall" — it's which of these four setups is actually carrying your results, and which is quietly dragging them down.
Specifically, you'd want to know, per strategy:
- Win rate
- Average R:R
- Net PnL contribution
- Drawdown
- Consistency over time, not just a single lucky stretch
In Excel, this means a pivot table (or a set of AVERAGEIF/SUMIF formulas) grouped by the strategy column — rebuilt or refreshed every time you want an updated view. In dedicated software, this is usually a standing dashboard that updates itself as new trades come in, so the comparison is always current without extra work.
The value here compounds the more strategies you run. With one or two setups, a quick mental tally is often enough. With four or more running in parallel — especially across different markets or timeframes — the strategy that feels like your best one and the strategy that the numbers say is your best one can quietly diverge, and the only way to catch that is to actually look at the breakdown regularly rather than rely on impression.
When Should You Switch From Excel to Trading Journal Software?
There's no fixed trade count at which someone "must" switch — it depends on how much time the spreadsheet is costing you and how much you value the analytics you're not currently getting. That said, a few signals tend to show up consistently:
- You've built up hundreds of trades and the sheet is getting genuinely slow or unwieldy.
- Your spreadsheet is difficult to maintain — formulas break, or you're afraid to touch it.
- You're spending real time building reports instead of reviewing your trading.
- You want analytics that update automatically, not on demand.
- You want screenshots attached directly to trades, not stored separately.
- You want structured psychology tracking instead of a notes column.
- You want strategy-level analysis without building it yourself each time.
- You want a workflow built specifically around trade review, not a general-purpose grid.
Who Should Use Excel?
Excel — or Google Sheets — is a good fit for:
- Beginners who are still figuring out what to track
- DIY-minded traders who enjoy building their own systems
- Traders with a small, manageable trading volume
- Traders who need a highly customized, non-standard workflow
Who Should Use Trading Journal Software?
Dedicated trading journal software tends to fit better for:
- Active traders logging trades frequently
- Traders running multiple strategies at once
- Traders who review performance regularly, not just occasionally
- Traders who want automated analytics without building them
- Traders who want structured psychology and mistake tracking
- Traders who want a dedicated, purpose-built review workflow
How Trade Journal Desk Compares
Trade Journal Desk is a modern alternative to a manually maintained spreadsheet — a digital trading journal built around the exact workflow described throughout this guide, rather than a general-purpose grid adapted to fit it.
It includes:
- A structured trade journal with automated PnL calculation
- Automatic risk and R:R tracking
- Strategy-level performance tracking
- Advanced analytics dashboards
- A trading calendar view
- Screenshots attached directly to trades
- Structured psychology and mistake tracking
- Performance reports built in, not built by hand
- A responsive interface with a dark theme
- Support for multiple markets — crypto, forex, stocks, and futures & options
- Multi-currency support
It doesn't replace the discipline of reviewing your own trading — nothing can do that for you. What it changes is how much manual work stands between logging a trade and actually learning something from it. As the brand puts it: Every Trade Tells a Story.
Trade Journal Desk Pricing
| Plan | Price | Duration |
|---|---|---|
| Free | ₹0 | 10 trades, lifetime |
| Monthly | ₹49 | 30 days |
| 6 Months | ₹249 | 180 days |
| Yearly | ₹449 | 365 days |
All paid plans include the exact same features — the only differences are price and subscription duration. There's no feature gating between the Monthly, 6-Month, and Yearly plans.
Frequently Asked Questions
Is Excel good for a trading journal?
Yes, for many traders — especially beginners with a manageable number of trades. Excel handles basic PnL and R:R calculations well and offers full customization. It starts to strain as trade volume and the number of questions you want answered both grow.
Is Google Sheets better than Excel for trading?
They're functionally similar for journaling purposes. Google Sheets has the edge in native cloud access and easier mobile viewing; Excel tends to handle very large sheets and complex formulas slightly more smoothly. Neither offers built-in trading analytics.
What is trading journal software?
Trading journal software is a purpose-built application for logging, calculating, and reviewing trades. It typically includes automated PnL and R:R calculations, strategy and risk analytics, psychology tracking, and screenshot attachments — all structured specifically around the trading workflow.
Should beginners use Excel or trading journal software?
Either can work. Excel is a low-friction way to build the habit of journaling early on. Dedicated software removes setup work and gives beginners analytics they'd otherwise have to build themselves — useful if you'd rather focus on reviewing trades than building spreadsheets.
Can Excel calculate trading PnL?
Yes. A simple formula — (Exit − Entry) × Quantity for a long position, or (Entry − Exit) × Quantity for a short — calculates gross PnL. Net PnL requires manually subtracting fees, commissions, and other costs.
What should I record in a trading journal?
At minimum: date, symbol, strategy, side, entry, exit, quantity, stop loss, take profit, PnL, and notes. A more complete journal also tracks fees, R:R, screenshots, emotion, mistakes, and tags.
Is a trading journal worth it?
For most traders who want to understand their own performance rather than guess at it, yes. A journal doesn't guarantee better results, but it turns vague impressions ("I feel like I lose on breakouts") into evidence you can actually check.
What is the best trading journal software?
The right choice depends on which markets you trade, which features you actually need, and your budget. Look for automated calculations, strategy and risk analytics, psychology tracking, and a workflow that fits how you already review trades.
Can I track crypto trades in a trading journal?
Yes. Both spreadsheets and dedicated software can log crypto trades — the same entry, exit, quantity, and PnL fields apply, with the addition of fields like funding rate for perpetual futures if relevant.
Can I track forex trades?
Yes. Forex journaling generally uses the same core fields, often with pip-based risk and reward alongside or instead of raw price values.
Can I track Indian stocks?
Yes. Indian equity and derivatives trades fit the same journal structure, with brokerage and statutory charges typically tracked separately from gross PnL to arrive at an accurate net figure.
Can I track options and futures?
Yes, though these instruments often benefit from a few extra fields — strike price, expiry, and lot size for options; contract size and margin for futures — beyond the basic spot-trading template.
Should I record losing trades?
Yes — losing trades are usually where the most useful lessons are. A journal that only records winners gives an incomplete, overly optimistic picture of actual performance.
How often should I review my journal?
A short review after each trading session, plus a deeper weekly and monthly review, is a common and practical rhythm. The exact frequency matters less than doing it consistently.
Can trading software track psychology?
Many dedicated trading journal tools include structured fields for emotion and mistakes, which make patterns easier to spot than a free-text notes column. The tracking itself doesn't fix psychology — it just makes patterns visible faster.
Can I attach screenshots to trades?
In Excel, screenshots are usually stored separately and linked manually. Dedicated trading journal software typically lets you attach a screenshot directly to the trade record, so the chart context and the data stay together.
Final Verdict
Excel remains a genuinely useful option for traders who want to build and maintain their own system — it's flexible, familiar, and free of any constraints beyond your own formulas. For a smaller trade count and simpler strategies, it can be all a trader needs for a long time.
Dedicated trading journal software becomes more valuable as that picture gets more complex: more trades, more strategies, more markets, and more questions you want answered without rebuilding a pivot table each time. Automated calculations, structured analytics, strategy tracking, psychology tracking, screenshots, and faster reviews are the trade-off for giving up some of that raw spreadsheet flexibility.
There's no single right answer for every trader — only the one that matches how much time you want to spend maintaining your tracking versus reviewing what it tells you. If you're ready to spend less time on the former, Trade Journal Desk is built to take that maintenance off your plate.
Every Trade Tells a Story.
Keep Exploring
Ready to understand your trading like never before?
Start using Trade Journal Desk and discover why Every Trade Tells a Story.