Table of Contents
- What Makes a Good Trading Journal?
- Step 1: Decide What You Want Your Journal to Achieve
- Step 2: Choose Your Trading Journal Format
- Step 3: Create Your Basic Trade Information Fields
- Step 4: Track Risk Before You Enter the Trade
- Step 5: Record Why You Took the Trade
- Step 6: Record Your Trading Psychology
- Step 7: Add a Screenshot to Every Important Trade
- Step 8: Record Whether You Followed Your Rules
- Step 9: Track the Result Correctly
- Step 10: Add a Trade Review Section
- Step 11: Review Your Journal Daily
- Step 12: Review Your Journal Weekly
- Step 13: Review Your Journal Monthly
- The Most Important Metrics to Track
- How to Turn Journal Data Into Better Decisions
- Common Trading Journal Mistakes
- How Many Trades Before Drawing Conclusions?
- Trading Journal Example
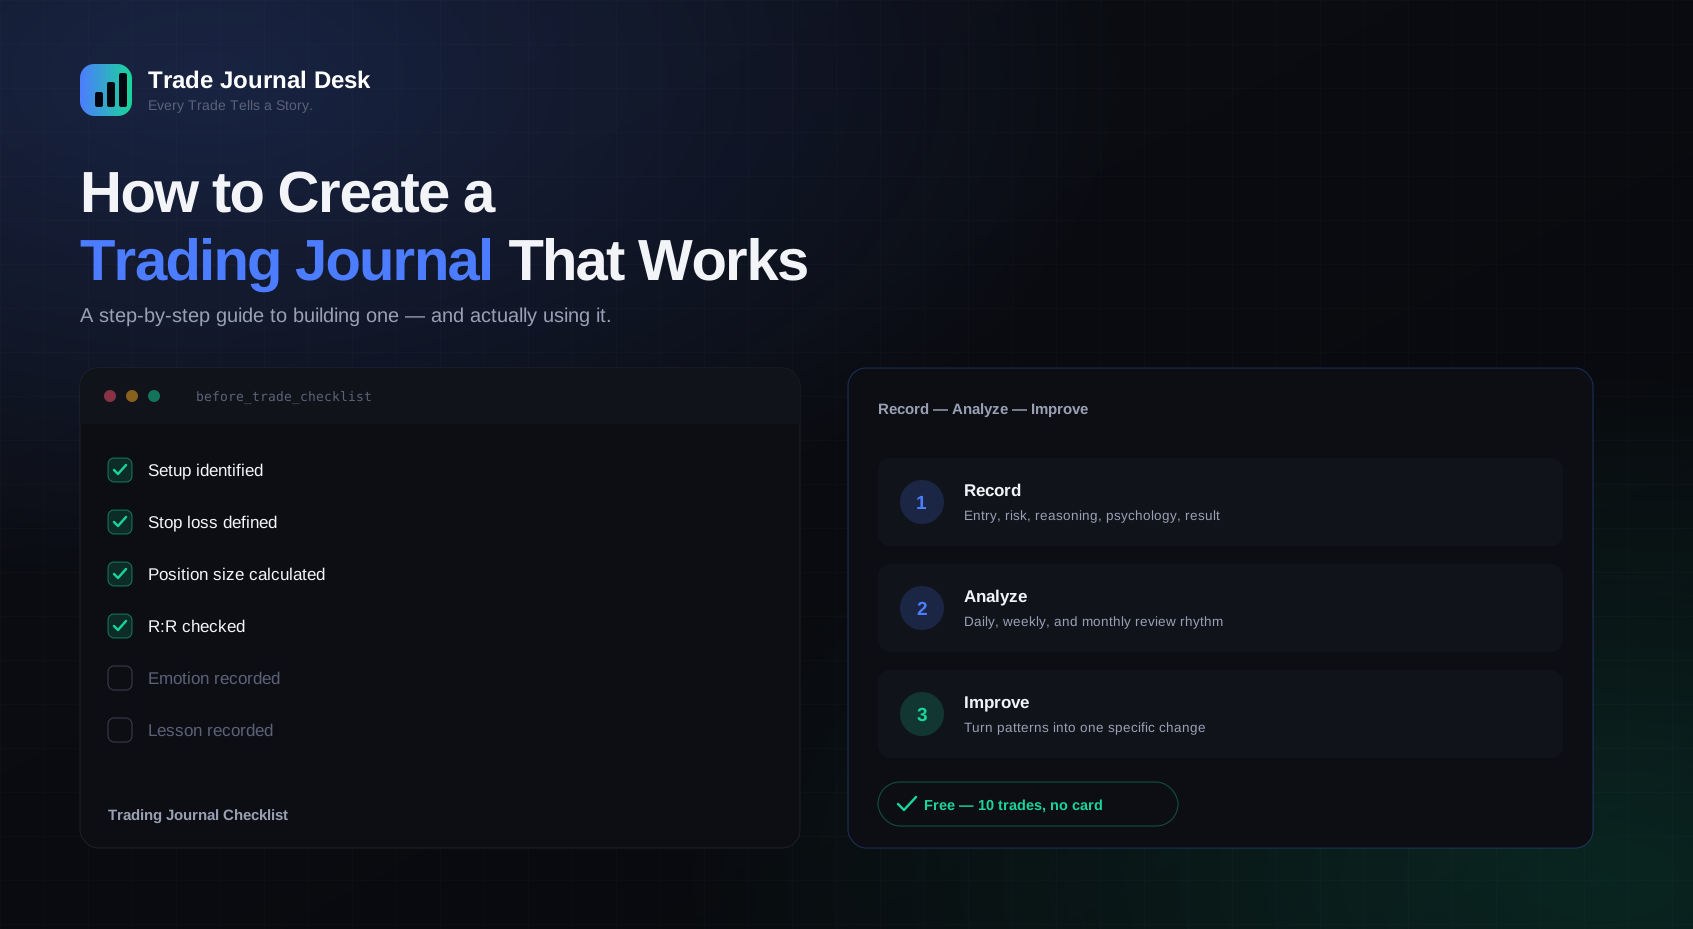
- Trading Journal Checklist
- How Trade Journal Desk Simplifies This Process
- Trading Journal for Different Markets
- How Often Should You Update Your Journal?
- Frequently Asked Questions
- Final Verdict
A trader closes their laptop at the end of the day with a vague feeling: "I think I traded well today." But ask a few follow-up questions and the picture falls apart fast:
- How much did you actually risk, across all of today's trades combined?
- Which strategy worked, and which one quietly didn't?
- Which trade broke your own rules?
- Was that loss caused by a bad strategy, or by bad execution of a good one?
- Were you actually calm, or quietly emotional the whole session?
- Did you overtrade without really noticing?
- Which setup is genuinely your best performer, not just your favorite?
A vague feeling can't answer any of that. A good trading journal can — not because writing things down is magic, but because it turns a blur of individual decisions into something you can actually measure. If you're still deciding whether journaling is worth the effort at all, why every trader needs a trading journal makes that case in detail. This guide assumes you're already convinced and skips straight to the part most articles skip: it isn't about what a trading journal is; it's about how to actually build one that works and, more importantly, how to use what it tells you. Don't just record trades — build a system for learning from them. Every Trade Tells a Story — this is how you make sure you're still able to read it.
What Makes a Good Trading Journal?
A useful trading journal captures three categories of information, not just one:
- Trade data — the raw facts: entry, exit, size, cost, result.
- Decision-making — why you took the trade, what you risked, and whether you actually followed your own plan.
- Review and learning — what the trade actually taught you, once you look back with a clear head.
Simply recording entry and exit prices covers the first category and stops there — which is why so many spreadsheets get abandoned after a few weeks: they answer "what happened" but never "why," so there's nothing to actually learn from. A good journal should be able to answer: What did I trade? Why did I enter? How much did I risk? What happened? How did I feel? Did I follow my rules? What can I learn? For the fundamentals behind this idea — what a trading journal actually is and why the definition matters — see the full trading journal guide.
To create a trading journal that actually improves your trading, record not just entry/exit prices but why you entered, how much you risked, your emotional state, and whether you followed your own rules — then review that data on a regular weekly and monthly rhythm to turn patterns into specific process changes.
Step 1: Decide What You Want Your Journal to Achieve
Before designing a single column, decide what you're actually trying to fix or find out. Different traders have different goals:
- Improve discipline
- Reduce overtrading
- Improve risk management
- Find the best-performing strategy
- Understand psychological patterns
- Improve overall consistency
- Simply track performance accurately
Pick two or three of these as your primary goals, not all seven. A journal built to track everything at once tends to collect fields nobody ever reviews — pick a focus, and let the format follow from it.
This matters more than it sounds. A trader whose main goal is reducing overtrading needs a journal that makes trade frequency and time-of-day easy to see at a glance. A trader trying to find their best strategy needs strong per-strategy breakdowns above almost everything else. Building the same generic journal regardless of the actual goal is why so many trading journals get filled in dutifully for a month and then quietly abandoned — the effort of logging never translates into an answer to the question that mattered. If you're a beginner and unsure which goals to prioritize first, choosing a trading journal as a beginner walks through the must-have starting point in more detail.
Step 2: Choose Your Trading Journal Format
The format matters less than actually using it consistently, but it's worth knowing the tradeoffs upfront.
| Feature | Paper | Excel | Google Sheets | Trading Journal Software |
|---|---|---|---|---|
| Trade entry | Manual, slow | Manual row entry | Manual row entry | Structured form |
| Calculations | None | Manual formula | Manual formula | Automatic |
| Analytics | None | Manual pivot tables | Manual pivot tables | Built in |
| Screenshots | Not practical | Stored separately | Stored separately | Attached to the trade |
| Psychology | Freeform only | Freeform column | Freeform column | Structured fields |
| Risk tracking | Manual | Manual formula | Manual formula | Automatic |
| Strategy tracking | Manual tally | Manual pivot table | Manual pivot table | Built-in dashboards |
| Search | Not practical | Basic filters | Basic filters | Purpose-built search |
| Reports | None | Manual construction | Manual construction | Generated automatically |
| Mobile experience | Physical only | Limited | Usable but cramped | Usually built for mobile |
| Maintenance | Low effort, low output | Grows harder over time | Grows harder over time | Stays roughly the same |
Paper works fine for building the initial habit. Spreadsheets work well at low trade volume. For a deeper look at exactly where spreadsheets start to strain and when dedicated software earns its keep, see Excel vs trading journal software.
Step 3: Create Your Basic Trade Information Fields
Whatever format you choose, these are the fields every complete trade record needs:
| Field | Example | Why Track It? |
|---|---|---|
| Date | 14 Aug 2026 | Reveals patterns by day and time period |
| Time | 09:32 | Shows session and time-of-day performance |
| Market | Crypto | Keeps comparisons meaningful across instruments |
| Symbol | BTCUSDT | Shows which instruments you actually perform on |
| Strategy | Breakout | The single most useful field for finding what works |
| Side | Long | Reveals any directional bias in results |
| Entry | 61,200 | The starting input for every other calculation |
| Exit | 63,100 | What actually happened versus the plan |
| Quantity | 0.02 | Converts price movement into real PnL |
| Stop Loss | 60,700 | Defines the risk you accepted going in |
| Take Profit | 63,500 | Defines the reward you were targeting |
| Fees | ₹40 | Separates trading performance from the cost of trading |
| Gross PnL | +₹3,420 | Raw result before costs |
| Net PnL | +₹3,380 | What you actually made or lost |
This is the same core structure covered in more depth in the full trading journal template guide, which walks through a ready-to-copy layout field by field.
Step 4: Track Risk Before You Enter the Trade
Risk should be written down before you know the outcome — not reconstructed afterward to justify whatever happened. Record:
- Entry price
- Stop loss
- Position size
- Risk amount (in currency, not just percentage)
- Target
- Potential reward
- R:R (reward divided by risk)
A trade risking ₹2,000 to make ₹6,000 (1:3 R:R) was a good bet the moment you took it — regardless of whether it happened to win or lose. Judging risk quality only by the eventual PnL is a common trap: a well-planned trade that lost is not the same mistake as an oversized, undefined-risk trade that happened to win. Writing the risk down before the outcome is known is what makes that distinction possible later.
This is also where position sizing earns its place in the journal, not just the trading plan. If your rule is to risk 1% of account capital per trade, the journal should show that rule actually being followed trade after trade — not just on the trades that happened to work out. A risk log that only gets filled in accurately when a trade wins isn't really tracking risk at all; it's tracking outcomes with extra steps.
Step 5: Record Why You Took the Trade
This is one of the most overlooked fields, and one of the most valuable. The journal needs to capture your actual trading thesis, not just the numbers. Common setups include breakout, pullback, trend continuation, reversal, support/resistance, EMA crossover, VWAP setup, and price action.
For every trade, answer:
- Why did I enter?
- What was the setup?
- What confirmed the trade?
- What would have invalidated the setup?
Without this, a losing trade and a rule-breaking trade look identical in the data six weeks later — you'll have the number, but not the reasoning that produced it.
Step 6: Record Your Trading Psychology
Most trading mistakes trace back to a small set of recurring emotional states: calm, confident, fearful, greedy, FOMO, impatient, angry, revenge, overconfident, and distracted. Track this at three points, not just one:
- Before the trade — your state of mind going in
- During the trade — whether that state shifted while the position was open
- After the trade — how the outcome made you feel
Tagging trades this way makes recurring patterns visible after a few dozen trades — for instance, discovering that "impatient" entries have a noticeably worse win rate than "calm" ones, or that "revenge" almost always shows up in the trade taken immediately after a loss. Neither of those patterns is obvious from a single trade; both become hard to miss once fifteen or twenty trades carry the same tag. This isn't a substitute for professional mental health support; it's a way to spot behavioral patterns in trading decisions specifically, nothing more.
Step 7: Add a Screenshot to Every Important Trade
A screenshot preserves what the chart actually looked like at entry — memory alone tends to quietly "clean up" the setup in hindsight, making a marginal trade look better-planned than it was. Capture the entry setup, chart structure, relevant indicators, entry point, stop loss, target, and exit. This one habit makes later reviews dramatically faster: instead of trying to recall the context, you're just looking at it.
Step 8: Record Whether You Followed Your Trading Rules
A short checklist after every trade:
- Did I follow my setup?
- Did I respect my stop loss?
- Did I use the correct position size?
- Did I enter according to my plan?
- Did I overtrade?
- Did I move my stop?
- Did I exit according to plan?
- Did emotions influence the decision?
This checklist is what separates three genuinely different things a journal can reveal: a bad trade (broke the rules, whatever the outcome), a good trade with a bad outcome (followed the plan, still lost — normal and expected sometimes), and a bad trade with a good outcome (broke the rules, got lucky). Conflating these three is one of the fastest ways to reinforce exactly the wrong habits.
Step 9: Track the Result Correctly
A complete result record includes gross PnL, fees, funding, commission, net PnL, R:R, win/loss status, and holding time. Take a simple long BTC example:
| Field | Value |
|---|---|
| Entry | 61,000 |
| Exit | 62,000 |
| Quantity | 0.01 BTC |
PnL = (Exit − Entry) × Quantity
PnL = (62,000 − 61,000) × 0.01 = 10 USDT before applicable costs.
For a short position, the formula flips since profit comes from the price falling: PnL = (Entry − Exit) × Quantity.
That 10 USDT is gross, not final. Actual net PnL will typically differ once fees, funding rates, commissions, and taxes are subtracted — always record both figures, not just one.
Step 10: Add a Trade Review Section
After every trade, a short written review — a few sentences, not an essay — answering:
- What did I do well?
- What did I do poorly?
- Did I follow my plan?
- Was the setup valid?
- Was the execution good?
- Was the risk appropriate?
- What would I repeat?
- What would I change?
Reused as a fixed checklist for every trade, this turns "I'll remember what happened" into an actual, comparable record across hundreds of trades.
Step 11: Review Your Journal Daily
Keep this short enough that you'll actually do it — a few minutes, not a formal session. Look at: trades taken, rule violations, emotional mistakes, biggest win, biggest loss, best decision, and worst decision of the day. The goal is catching an obvious pattern before it has a chance to repeat tomorrow, not producing a full report.
Step 12: Review Your Journal Weekly
A deeper look, once a week:
- Total trades
- Win rate
- Net PnL
- Average win and average loss
- Average R:R
- Best and worst strategy
- Best and worst symbol
- Long vs. short performance
- Rule violations
- Psychology patterns
Then ask one specific question: "What is the one thing I should improve next week?" Not five things — one. A weekly review that produces a single, concrete change is more useful than one that produces a long list nobody follows through on.
Step 13: Review Your Journal Monthly
Monthly review goes deeper: monthly PnL, drawdown, profit factor, expectancy, strategy performance, symbol performance, session performance, psychology trends, risk consistency, and losing/winning streaks. The monthly review should focus on trends, not individual trades — a single bad week can look alarming in isolation but be unremarkable against three months of data. For a fuller walkthrough of building this review habit day to day, see how to keep a trading journal.
The Most Important Metrics to Track
| Metric | What It Means |
|---|---|
| Win Rate | The percentage of closed trades that were profitable |
| Average Win | The average size of your winning trades |
| Average Loss | The average size of your losing trades |
| Net PnL | What you actually made or lost after all costs |
| Profit Factor | Gross profit divided by gross loss — above 1 means you're net profitable |
| Expectancy | The average amount you can expect to make or lose per trade, based on your history |
| Average R:R | Whether your wins are structurally bigger than your losses |
| Maximum Drawdown | Your worst peak-to-trough decline in account value |
| Winning Streak | Your longest run of consecutive wins |
| Losing Streak | Your longest run of consecutive losses |
| Number of Trades | Your sample size — the basis for trusting any of the above |
| Risk per Trade | How much of your account you're risking on a single position |
| Strategy Performance | Win rate, R:R, and net PnL broken down per strategy |
| Symbol Performance | The same breakdown, per instrument traded |
You don't need every one of these to start — win rate, average R:R, net PnL, and strategy performance cover most of what a beginner needs. The rest become more useful as your trade count grows. Two of these are worth understanding a little deeper because they get misread often: profit factor above 1.0 means you're net profitable, but a profit factor of 1.1 built on a tiny sample is far less reassuring than a profit factor of 1.5 built on a large one. Expectancy answers a slightly different question — not "am I profitable" but "how much should I expect to make, on average, the next time I take this exact type of trade" — which is closer to what you actually want to know before sizing up a strategy.
How to Turn Journal Data Into Better Decisions
Recording data is only half the job. The part that actually improves your trading is what happens next:
Record
Log the trade completely — data, reasoning, risk, psychology, and result.
Analyze
Review the data on your daily, weekly, and monthly rhythm.
Find a Pattern
Look for something that repeats across multiple trades, not a one-off.
Create a Hypothesis
State a specific, testable explanation for what you found.
Test
Apply a specific change and track it going forward, deliberately.
Improve
Keep the change if the data supports it — or drop it and try the next hypothesis.
Here's what that looks like in practice. Say your journal shows you repeatedly losing on breakout trades. It's tempting to conclude "my breakout strategy doesn't work" and abandon it. But that skips a step — the journal's other fields (entry reasoning, rule-followed checklist, psychology tags) let you actually investigate why. Were most of those losses on setups that met your entry criteria, with a stop loss respected and no rule violations? That points to a strategy problem. Or were most of them tagged "FOMO" or "late entry," with the checklist showing the setup wasn't fully confirmed before entry? That points to an execution problem — a very different fix than scrapping the strategy entirely.
The hypothesis-and-test step is the one traders skip most often, usually because it requires waiting — you can't know whether a change actually helped after just two or three trades. A useful test needs roughly the same sample size you'd want before trusting any other conclusion from the journal, which is exactly why the next section matters as much as it does.
Common Trading Journal Mistakes
- Only recording winning trades — gives an incomplete, overly optimistic picture, and quietly inflates every win-rate and average-PnL figure calculated from the data.
- Not recording emotions — hides the psychological patterns behind your worst decisions, since those patterns rarely show up in the price data alone.
- Not recording screenshots — makes later review dependent on unreliable memory, which tends to "clean up" a setup in hindsight.
- Tracking too many unnecessary fields — turns logging into a chore you eventually abandon; a journal you stop using is worth less than a simpler one you keep filling in.
- Never reviewing the journal — the single most common failure mode; recording without reviewing changes nothing, no matter how detailed the data is.
- Changing the system constantly — makes it impossible to compare data across periods, since you're never measuring quite the same thing twice.
- Judging a strategy from too few trades — a handful of trades proves very little either way, in either direction.
- Ignoring losing trades — often the trades with the most to teach, especially the well-planned ones that simply didn't work out.
- Recording trades after the fact — reasoning and emotion fade fast; log same-day, ideally within the hour.
- Focusing only on PnL — misses everything the journal is actually for: process, not just outcome. A profitable month built on broken rules is a warning sign, not a win.
How Many Trades Do You Need Before Drawing Conclusions?
There's no universal number, and treating any specific figure as a hard rule is a mistake in itself. A single trade tells you very little — it could be a great decision that happened to lose, or a poor one that happened to win. A small sample of ten or twenty trades can still be noisy, shaped as much by short-term luck as by the quality of the underlying strategy. Larger samples generally provide more reliable information, but the number that matters isn't fixed — it depends on how consistent your strategy, risk, execution, and market conditions have been across those trades. A hundred trades taken with a constantly changing approach tell you less than fifty taken with a genuinely consistent one.
What actually shifts the reliability of a conclusion isn't the raw count — it's whether the trades being compared are actually comparable. Fifty breakout trades taken with the same entry criteria, the same risk per trade, and roughly similar market conditions form a meaningful sample. Fifty trades that mix three different strategies, wildly different position sizes, and both trending and choppy markets don't — the average result blends several different things together and tells you less about any one of them than the raw number suggests.
Trading Journal Example
The table below is fictional example data for educational purposes only — not real trading results or a performance claim.
| Date | Symbol | Strategy | Side | Entry | Exit | Qty | Stop Loss | Net PnL | R:R | Emotion | Rule Followed? | Mistake | Lesson |
|---|---|---|---|---|---|---|---|---|---|---|---|---|---|
| 03 Aug | BTCUSDT | Breakout | Long | 61,200 | 63,100 | 0.02 | 60,700 | +₹3,380 | 1:2.4 | Calm | Yes | None | Setup followed exactly as planned |
| 05 Aug | EURUSD | Pullback | Short | 1.0850 | 1.0875 | 1 lot | 1.0865 | −₹2,050 | 1:1.5 | Impatient | No | Entered early | Wait for full confirmation next time |
| 07 Aug | NIFTY24800CE | VWAP Reversal | Long | 145 | 190 | 50 | 120 | +₹2,250 | 1:3.1 | Confident | Yes | None | Best-performing setup this week |
| 09 Aug | XAUUSD | NY Killzone | Short | 2,415 | 2,428 | 0.5 lot | 2,420 | −₹650 | 1:1.8 | Revenge | No | Oversized after prior loss | Skip trading immediately after a loss |
| 11 Aug | ETHUSDT | EMA Crossover | Long | 3,400 | 3,520 | 0.3 | 3,340 | +₹1,140 | 1:2.0 | Calm | Yes | None | Consistent with plan and average R:R |
| 13 Aug | RELIANCE | Support Bounce | Long | 2,900 | 2,875 | 10 | 2,870 | −₹250 | 1:1.7 | FOMO | No | Chased a move already underway | Only enter at the planned level, not after it's moved |
Trading Journal Checklist
A reusable checklist for every trade — copy it into your journal, or keep it beside your trading setup.
Before Trade
- Setup identified
- Strategy identified
- Entry defined
- Stop loss defined
- Position size calculated
- Risk amount defined
- Target defined
- R:R checked
During Trade
- Followed the plan
- No emotional changes mid-trade
- No unnecessary adjustment to stop or target
After Trade
- Exit recorded
- PnL recorded
- Screenshot saved
- Emotion recorded
- Mistake recorded, if any
- Lesson recorded
How Trade Journal Desk Simplifies This Process
Everything above is achievable in a notebook or a spreadsheet — it's just a lot of manual structure to build and maintain yourself. Instead of juggling a spreadsheet, a separate folder of screenshots, and a notes app for psychology, Trade Journal Desk brings that whole workflow into one place. It includes:
- Structured trade entries with automated PnL calculation
- Automatic risk and R:R tracking
- Strategy-level performance tracking
- Built-in analytics dashboards
- A trading calendar view
- Screenshots attached directly to trades
- Structured psychology tracking
- Structured mistake tracking
- Built-in performance reports
- A responsive, dark-themed interface
- Support for crypto, forex, commodities, and Indian stocks
- Multi-currency support
The goal isn't to replace the thinking this guide walks through — it's to remove the manual overhead around it, so more of your time goes to actually reviewing your decisions instead of maintaining the system that records them. Every Trade Tells a Story — Trade Journal Desk is built to help you read it faster.
Trading Journal for Different Markets
The core structure above applies across markets, with a few small differences worth knowing:
- Crypto — 24/7 markets make session and time-of-day fields especially useful; consider tracking funding fees separately for perpetual futures.
- Forex — pip-based risk and reward often sit alongside or instead of raw price values.
- Commodities — worth noting whether you're trading a spot-style instrument or a futures contract, since contract specs affect position sizing.
- Indian stocks — brokerage and statutory charges are usually worth tracking separately to arrive at accurate net PnL.
- Futures — contract size and margin add extra fields beyond the basic spot template.
- Options — strike price, expiry, and lot size matter alongside the standard entry/exit fields.
None of this changes the underlying discipline — every market benefits from the same habit of recording the decision, not just the outcome.
How Often Should You Update Your Trading Journal?
Before the trade
Setup, strategy, entry, stop, target, and risk — written down before you're in the position.
Immediately after the trade
Exit, result, screenshot, emotion, and a quick note — while it's still fresh.
Daily review
A short scan for rule violations and standout decisions, good or bad.
Weekly review
Win rate, R:R, strategy and symbol performance, and one specific thing to improve.
Monthly review
Trends across drawdown, profit factor, expectancy, and psychology — not individual trades.
Frequently Asked Questions
How do I start a trading journal?
Pick a format you'll actually use — paper, spreadsheet, or software — then record the core fields (date, symbol, strategy, entry, exit, risk, result) for every trade starting today. Consistency matters more than a perfect template on day one.
What should I include in a trading journal?
At minimum: date, symbol, strategy, side, entry, exit, quantity, stop loss, fees, and net PnL. A complete journal also tracks R:R, psychology, screenshots, rule adherence, and a short written review per trade.
What is the best format for a trading journal?
Whichever one you'll use consistently. Paper suits habit-building, spreadsheets suit low trade volume, and dedicated software suits traders who want automated calculations and analytics without building them manually.
Is Excel good for trading journals?
Yes, for many traders — fully customizable and free, though formulas and analytics have to be built and maintained by hand. See spreadsheet vs trading journal software for a full comparison.
Should I record every trade?
Yes. Skipping trades — especially losing ones — leaves gaps that quietly distort every statistic calculated from the data.
Should I record losing trades?
Especially losing trades. A well-planned trade that lost and a rule-breaking trade that lost look identical if you don't record the reasoning and rule-adherence behind each one.
Should I include screenshots?
Yes, for anything you'll want to review later. A screenshot preserves the actual chart context that memory tends to reshape in hindsight.
Should I record emotions?
Yes — emotion is one of the highest-value fields, since cross-referencing it against outcomes is often where a trader's most expensive recurring mistake becomes visible.
How often should I review my journal?
A quick check after every trade, a short daily scan, a deeper weekly review, and a full monthly review focused on trends rather than individual trades.
What trading metrics should I track?
Win rate, average win/loss, net PnL, average R:R, and strategy/symbol performance cover most needs early on. Profit factor, expectancy, and drawdown become more useful as your trade count grows.
How do I calculate trading journal PnL?
For a long trade: (Exit − Entry) × Quantity. For a short trade: (Entry − Exit) × Quantity. Subtract fees, commissions, and other costs to get net PnL.
What is R:R in a trading journal?
Risk-to-reward — the potential reward divided by the risk taken on a trade. A 1:3 R:R means the potential profit was three times the amount risked.
What is the difference between a trade log and a trading journal?
A trade log is a bare record of entries, exits, and outcomes. A trading journal also captures the reasoning, risk, psychology, and lessons behind each trade — the part that actually enables improvement.
Can beginners use a trading journal?
Yes — starting the habit early, before patterns and mistakes become deeply ingrained, tends to matter more than any specific template used.
Can I journal crypto trades?
Yes. Crypto trades use the same core fields, with the option to track funding fees separately for perpetual futures.
Can I journal forex trades?
Yes. Forex journaling typically uses the same structure, often with pip-based risk and reward alongside raw price values.
Can I journal Indian stocks?
Yes. Indian equity and derivatives trades fit the same structure, usually with brokerage and statutory charges tracked separately for accurate net PnL.
Can I use Trade Journal Desk for multiple markets?
Yes — it supports crypto, forex, commodities, Indian stocks, US stocks, and futures & options, with multi-currency support built in.
Is Trade Journal Desk free?
Yes — the Free plan includes 10 trades with no time limit and no card required. Paid plans start at ₹49 for 30 days.
How many free trades are available?
10 free trades, lifetime, with no card required to start.
Final Verdict
A trading journal shouldn't just tell you whether you made money. It should help you understand why you entered, how you managed risk, how you executed, how you felt, what actually happened, and — most importantly — what you can improve next time.
None of the steps in this guide are complicated on their own — the fields, the checklist, the review rhythm are all straightforward. The part that actually separates a journal that changes how someone trades from one that gets abandoned after three weeks is consistency: filling it in the same way, for every trade, and actually sitting down to review it on the schedule you set for yourself.
Trade Journal Desk is a trading journal and analytics tool. It does not provide investment advice, trading signals, or guarantees of profit. Trading involves risk.
Every Trade Tells a Story.
Start Journaling Free — 10 free trades, no payment required to start.
Keep Exploring
Ready to understand your trading like never before?
Start using Trade Journal Desk and discover why Every Trade Tells a Story.